


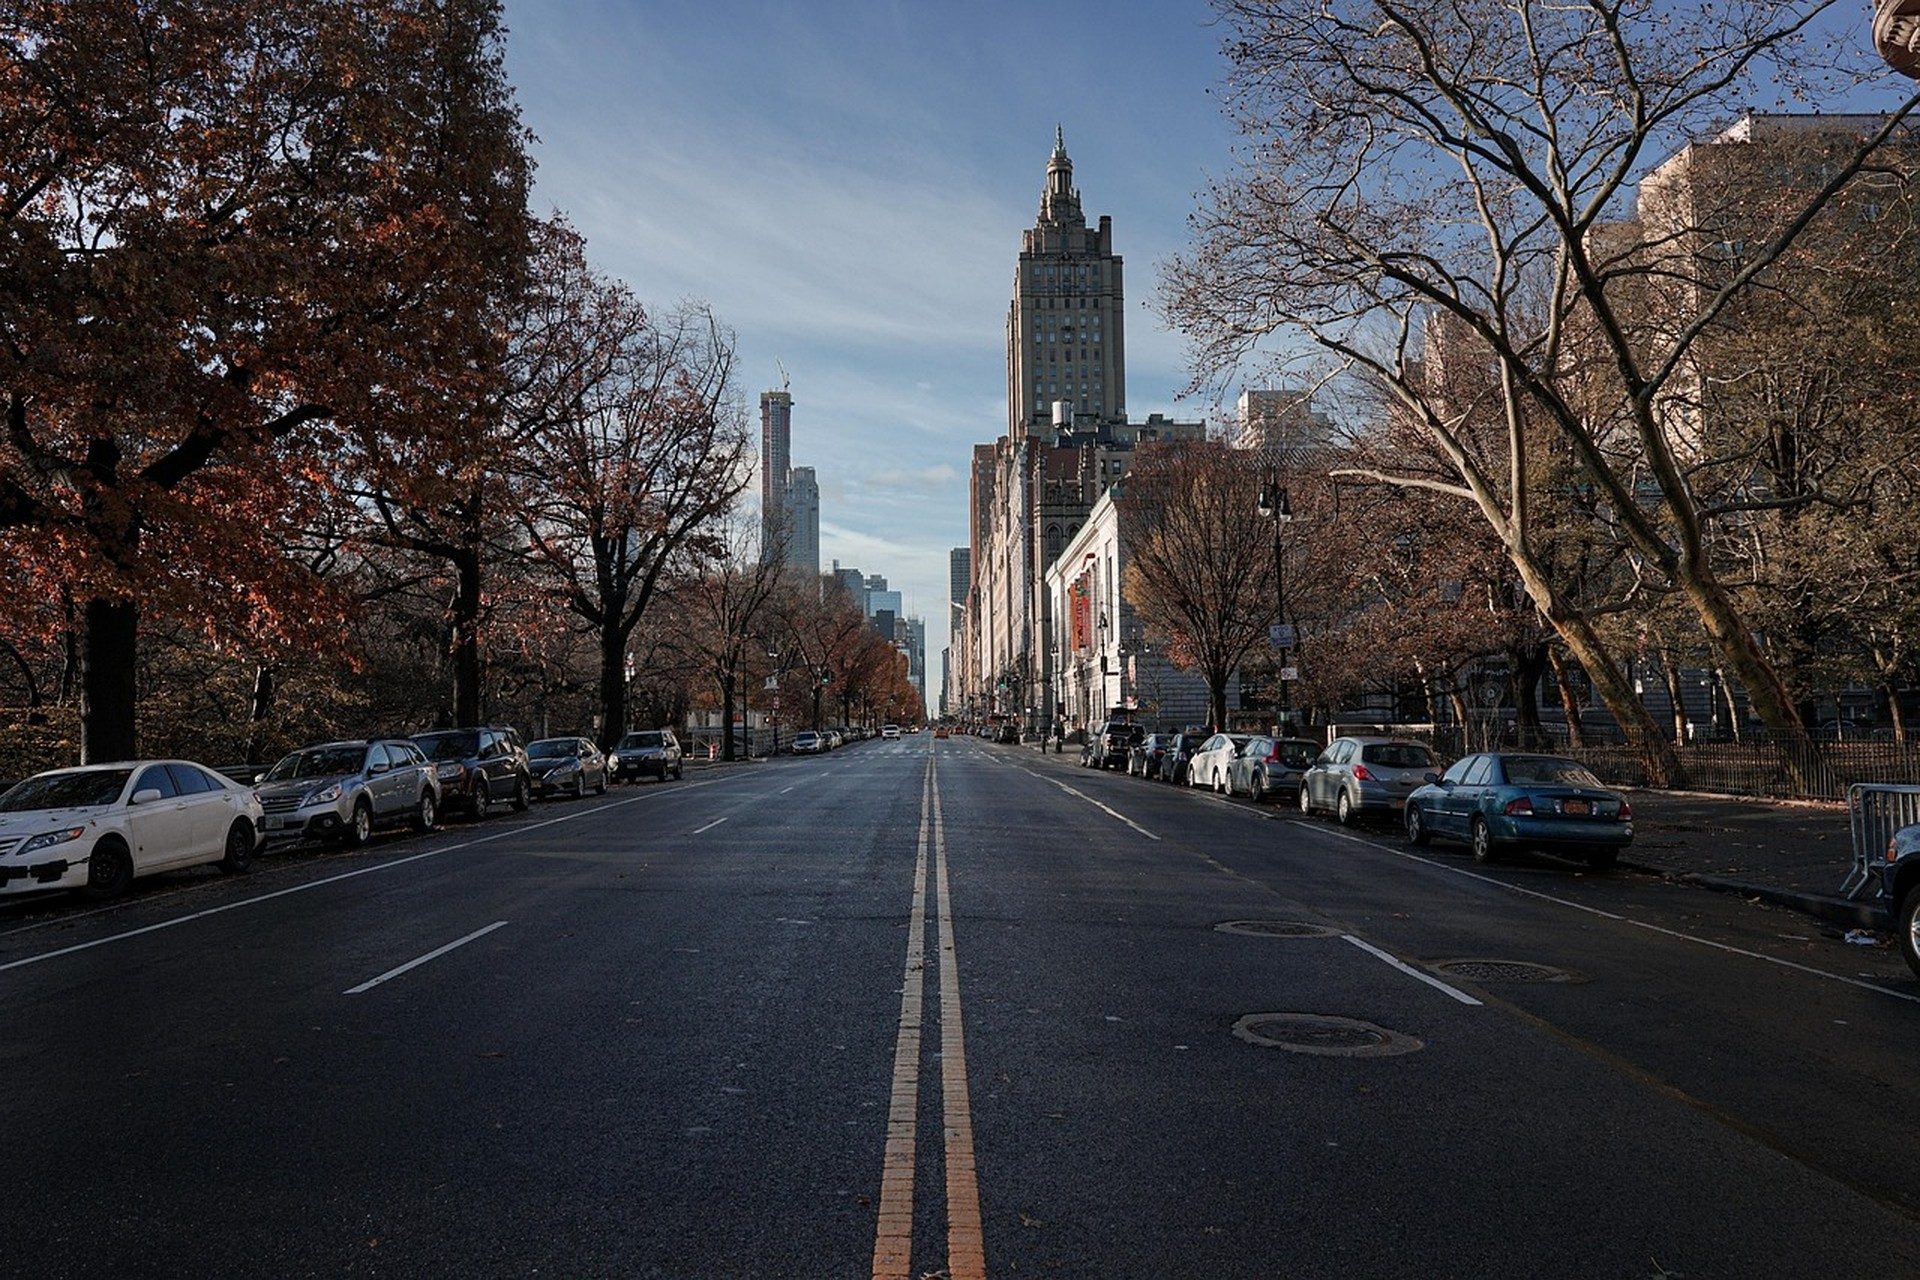
Manhattan retail foot traffic recovered in uneven waves after the sharpest pandemic drops, and the newyork mkt retail foot traffic manhattan misreads still trip up otherwise careful observers. Street counts alone rarely tell the full story. A block that looks lively at noon can empty after 6 p.m., while a quieter corridor may deliver steadier sales once tourists and hybrid workers align. Foundation tracks these patterns because they shape lease negotiations, store formats, and the capital that flows into ground-floor space across the borough.
Why Pedestrian Counts on Fifth Avenue Still Mislead Investors
Raw tallies of people walking past a storefront feel objective, yet they often overstate demand. Many passersby never enter; others window-shop without wallets. Tour groups and construction crews inflate numbers without raising conversion rates. A better lens pairs counts with dwell time and basket size. When those secondary metrics lag, the apparent recovery is cosmetic. Landlords who price rents solely on peak-hour density later face vacancy when the novelty fades.
Seasonal festivals and pop-up events further distort the picture. A holiday window display can double footfall for three weeks and then collapse. Investors who annualize that spike misjudge the base. Cross-checking with same-store sales growth and credit-card geolocation data reduces the error. The Federal Reserve Bank of New York regularly publishes regional indicators that help separate temporary crowds from durable demand.
Midtown Lunch Crowds Versus Evening SoHo Surges
Office workers still dominate midday Midtown corridors, yet their presence now peaks on Tuesdays through Thursdays. Mondays and Fridays remain thinner. Retailers that once thrived on five full workdays must rethink staffing and inventory. Meanwhile SoHo and parts of the West Village see their strongest traffic after dark and on weekends, driven by dining and entertainment rather than commuting.
These two rhythms rarely move in lockstep. A rebound in Midtown lunches does not guarantee evening spend downtown. Operators who expand without mapping the hour-by-hour profile often overstaff or understock. Mapping tools that layer mobile-device signals against time of day reveal the mismatch early. For deeper context on how hybrid schedules also reshape larger commercial assets, see the discussion of Manhattan Real Estate in 2026: Office Dislocation and the Debt Maturity Wave.
Transit Ridership as a Quiet Proxy for Store Visits
Subway and bus entries into commercial stations often lead retail recovery by several weeks. When ridership climbs, store visits usually follow, provided the line serves mixed-use nodes rather than pure residential stops. Stations around Herald Square, Union Square, and Columbus Circle have historically offered the clearest signals. Tracking weekly average entries rather than single-day spikes filters out weather or special-event noise.
MetroCard and OMNY data, when anonymized and aggregated, also show which boroughs feed the busiest Manhattan corridors. Rising reverse-commute flows from Brooklyn or Queens can lift weekend traffic even when Midtown office attendance plateaus. The US Federal Reserve notes that labor-market tightness and wage growth influence discretionary travel; those same factors feed retail spending once people leave the train.
How Office Returns Shape Weekend Shopping Patterns
Hybrid work rearranged the calendar more than the map. Workers who come in midweek often treat Friday or Saturday as their personal shopping day. Neighborhoods that once emptied after 5 p.m. now host longer retail hours. Yet the benefit is uneven. Areas dependent on pure office density, such as parts of the Financial District, still lag places that already mixed residences and hotels.
Lease renewals increasingly hinge on whether a landlord can prove weekend lift. Foot-traffic heat maps that cover Saturday and Sunday have become negotiation staples. When those maps stay cold, tenants push for percentage rent or shorter terms. Related infrastructure investments, including denser mobile coverage, improve the accuracy of those maps; readers exploring connectivity can review 5G Infrastructure and Its Impact on New York Real Estate Demand.
Weather, Tourism, and the Data Gaps That Fool Analysts
Rain and extreme cold suppress outdoor retail more than indoor malls, yet many public dashboards fail to adjust counts for weather. A 20 percent drop on a stormy day can look like a structural decline if the baseline was set during mild weather. Tourism adds another layer. International visitors concentrate in Midtown and lower Manhattan, while domestic travelers spread more evenly. Without origin data, a rebound in foreign arrivals can be mistaken for local recovery.
Hotel occupancy and airport arrivals serve as useful cross-checks. When those series rise but street counts do not, the missing piece is often destination choice or day-of-week mismatch. Housing and urban research from HUD User research underscores how neighborhood composition affects visitor flow, reminding analysts that pure commercial corridors behave differently from mixed residential ones.
Construction activity itself creates temporary blind spots. Scaffolding and sidewalk sheds reduce visible traffic even when nearby sales hold steady. Cost pressure on new builds can delay openings and keep those sheds in place longer; the NYC Construction Cost Inflation Index: Fast Orientation for Curious Allocators helps quantify that drag.
Linking Street Density to Lease Renewal Odds
Landlords care less about absolute footfall than about the density that converts into sales sufficient to cover rent. Renewal probability rises when a corridor shows multi-day consistency rather than single-peak spikes. Tenants track the same numbers to decide whether to stay, downsize, or exit. Percentage-rent clauses now often reference third-party traffic indices instead of pure sales, shifting some risk back to property owners.
Portfolio managers who own several Manhattan assets compare recovery curves across submarkets to reallocate capital. A corridor that recovers traffic but not sales may need repositioning toward experiential or service uses. One high-profile case of large-scale adaptation appears in the Hudson Yards Repositioning Strategy: What New Readers Should Know, which shows how mixed-use planning can rebuild daytime and evening density together.
Life-sciences and specialized facilities nearby can also alter retail mix by changing the daytime population. Clean environments and lab workers create new lunch and after-work demand patterns; the role of specialized space is detailed in Cleanroom and Lab Facilities Behind New York's Life Sciences Sector.
Reading Recovery Through Card Swipes and Phone Signals
Payment networks and anonymized location data now supplement older camera counts. Card-swipe volume by merchant category code shows whether apparel, dining, or services are driving the rebound. Phone-signal dwell times indicate how long people linger. When both series improve in tandem, the recovery is more trustworthy than either alone. Public-company filings sometimes disclose these metrics; the US Securities and Exchange Commission hosts the reports that sophisticated readers parse for early clues.
Smaller operators without access to premium data can still approximate the picture. Comparing weekly sales against published subway entries and weather-adjusted baselines removes much of the noise. Foundation’s broader coverage of local commercial shifts lives in the New York Real Estate Market Trends archive, while practical answers to recurring questions appear on the FAQ (frequently asked questions) page. Fresh commentary continues on the Blog.
Ultimately, foot-traffic recovery in Manhattan is a mosaic of office calendars, tourist seasons, weather, transit, and payment behavior. Tracking only the loudest signal invites the classic newyork mkt retail foot traffic manhattan misreads that have already cost some owners months of wasted rent freezes. Combining several quiet proxies yields a clearer, more durable view of which streets are truly back and which still need time or a different tenant mix.
Related Foundation reading: Our approach and Foundation World New York hub.
Timeless Value. Perpetual Legacy.



