


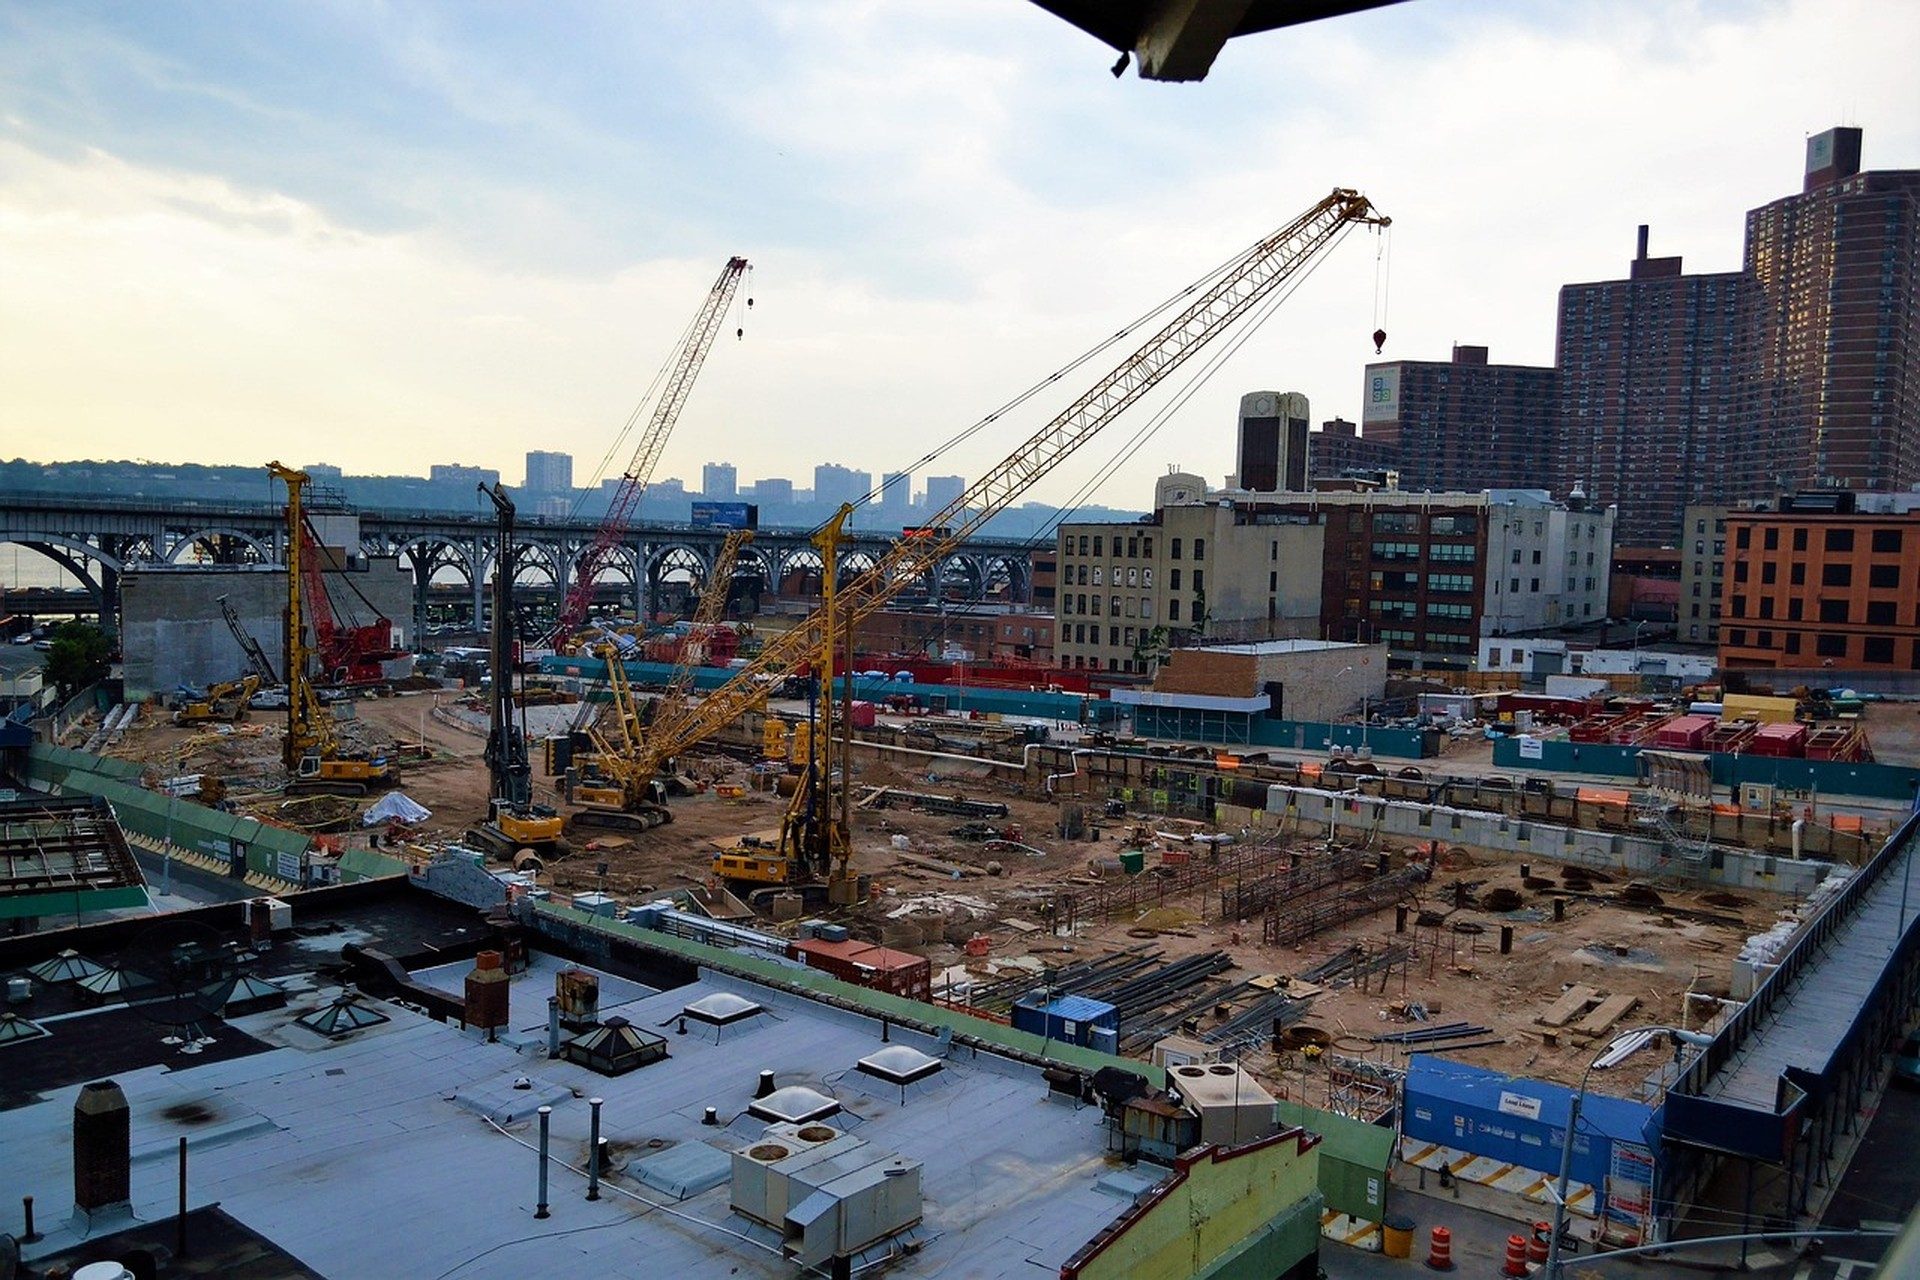
Curious allocators who watch New York building budgets often meet a single number first: the NYC Construction Cost Inflation Index. That figure compresses labor rates, steel and concrete prices, insurance loads, and permit friction into a percentage change that moves every quarter. Understanding what it captures and what it leaves out keeps capital decisions grounded rather than reactive.
Foundation tracks this measure because it sits at the intersection of physical projects and portfolio math. When the index accelerates, hard-cost contingencies expand, lease-up timelines stretch, and debt service coverage looks thinner. When it cools, opportunities appear in adaptive reuse and selective ground-up work. The following sections give a fast orientation without assuming prior expertise in construction economics.
What the Index Compresses Into One Percentage
The NYC Construction Cost Inflation Index aggregates price movements for trades, materials, equipment, and soft costs that dominate metro building. It is not a forecast of finished-project totals; it is a pulse on the cost of inputs. A rise of four percent over twelve months signals that the same scope of work now requires more dollars before design fees or financing spreads are layered on top.
Public data from the City of New York help calibrate local components such as prevailing-wage schedules and waste-hauling fees. Private surveyors then blend those inputs with national commodity series. The resulting number lets an allocator compare last year’s bid package with today’s without opening every line item.
Readers new to the series sometimes treat the index as a pure materials gauge. That reading misses the labor share, which frequently exceeds half the hard-cost total in high-rise Manhattan work. Overtime premiums, apprenticeship pipelines, and union negotiations therefore move the index even when lumber or copper prices sit still.
Why Allocators Glance Here Before Writing Checks
Capital that funds office conversions, multifamily towers, or industrial shells must survive multi-year construction windows. An index that has climbed faster than expected can erase projected returns before the first tenant deposit arrives. Checking the trend therefore becomes a gatekeeping habit for anyone evaluating New York exposure.
The same check informs conversations with lenders and limited partners. When the index is rising, sponsors who show detailed contingency buffers and phased procurement plans tend to clear credit committees more cleanly. When the index is flat or falling, aggressive schedules and thinner reserves look more credible. Either way, the number supplies a shared reference point that cuts through marketing language.
Stakeholders who follow the newyork mkt nyc construction cost inflation stakeholders conversation also use the index to time equity calls. Raising capital while costs are still climbing can lock in higher budgets; waiting for a pause can improve basis, provided the site or entitlement remains available.
Labor Materials and Land as Distinct Drivers
Labor shortages remain the most stubborn local factor. Skilled trades face retirement waves and competition from infrastructure programs outside the five boroughs. Wage packages adjust, and those adjustments feed straight into the index. Materials, by contrast, swing with global supply chains and energy prices, sometimes decoupling from local employment conditions for several quarters at a stretch.
Land prices sit outside the pure construction series yet influence total project cost. When residual land values climb, developers sometimes accept higher hard costs to keep a site under control. The reverse also occurs: soft land markets can absorb some inflation and keep all-in budgets stable. Allocators who separate these three engines avoid mistaking one temporary spike for a structural regime change.
Insurance and financing costs add further layers. Premium hikes after major weather events or liability rulings raise the effective cost of placing a shovel in the ground even when union rates and steel coils hold steady. Those soft-cost movements appear in broader project models even if the headline construction index itself moves only modestly.
Reading the Gauge Against Broader Market Signals
Construction inflation rarely travels alone. Office vacancy, rent growth, and debt maturities all interact with building budgets. A useful cross-check appears in Manhattan Real Estate in 2026: Office Dislocation and the Debt Maturity Wave, which shows how empty towers and refinancing walls can freeze or accelerate capital spending.
Class distinctions matter too. Premium towers often absorb cost overruns more easily than mid-market assets. Data on Class A Versus Class B Office Spreads: 2026 Data and Macro Context help an allocator judge whether the inflation index is biting hardest in the segment that still commands rent premiums or in the segment already under pressure.
Industrial and logistics properties face their own cost curves. Sites that support advanced manufacturing or last-mile distribution often require specialized foundations and power upgrades. Material on Logistics Real Estate Supporting New York's Tech Manufacturing Base illustrates how those requirements can amplify or mute the general construction index depending on trade mix.
Policy Rates and Regulatory Friction
Interest-rate paths set by the US Federal Reserve alter the carrying cost of construction loans and therefore the urgency of completing work on schedule. Higher rates make every month of inflation more expensive; lower rates give sponsors breathing room to wait for better bids. The index itself does not contain rate data, yet the two series are routinely plotted together by sophisticated capital teams.
Federal securities rules also shape disclosure. Publicly traded real-estate investment trusts must report material cost overruns under guidance from the US Securities and Exchange Commission. Those filings supply real-world validation of whether private index readings match actual project experience.
Housing-policy research published through HUD User research adds another lens, especially for multifamily and mixed-income schemes that rely on layered subsidies. When those programs tighten or expand, the volume of construction starts changes and, with it, competitive pressure on the very trades that drive the inflation index.
Global Inputs That Still Hit Local Budgets
New York projects import steel, curtain-wall systems, and specialized mechanical equipment from overseas. Currency moves and trade friction therefore show up in the local cost series. Periodic reviews of IMF publications help place those global price waves in context so that an allocator does not over-attribute a spike to purely domestic factors.
Data centers and network nodes that serve the metro area also require heavy construction. Understanding the physical layer of connectivity, covered in Cross-Border Data Infrastructure Linking New York to Global Networks, shows how specialized build-outs can pull scarce trades away from more conventional office or residential jobs and thereby lift the broader index.
Large-scale repositioning exercises further illustrate the point. Work underway at major mixed-use districts, including the approach outlined in Hudson Yards Repositioning Strategy: What New Readers Should Know, demonstrates how concentrated demand for skilled labor and materials can create temporary hotspots that the citywide index only partially captures.
Avoiding Overfitting While Still Using the Signal
No single percentage should dictate an entire capital allocation. The index is most powerful when treated as a directional alert that prompts deeper diligence rather than a mechanical go or no-go switch. Pairing it with site-specific bid comparisons, contractor balance sheets, and schedule risk analysis keeps decisions robust.
Seasoned teams also watch second-order effects. A cooling construction index can encourage more starts, which later re-tightens labor markets. That feedback loop means today’s relief can plant the seeds of tomorrow’s pressure. Historical series stored in the New York Real Estate Market Trends archive help map those cycles across prior decades.
Foundation maintains plain-language answers to recurring questions about indices, contingencies, and market timing inside its FAQ (frequently asked questions). Those entries complement the longer-form pieces that appear regularly on the Blog, giving both newcomers and veterans a place to test their reading of the latest construction cost print.
In short, the NYC Construction Cost Inflation Index supplies a compact, regularly updated signal. Allocators who understand its composition, its drivers, and its limitations can fold it into broader judgment without letting one number dominate the conversation. That balance remains the practical edge in a market where every basis point of cost ultimately competes with every basis point of return.
Timeless Value. Perpetual Legacy.



