


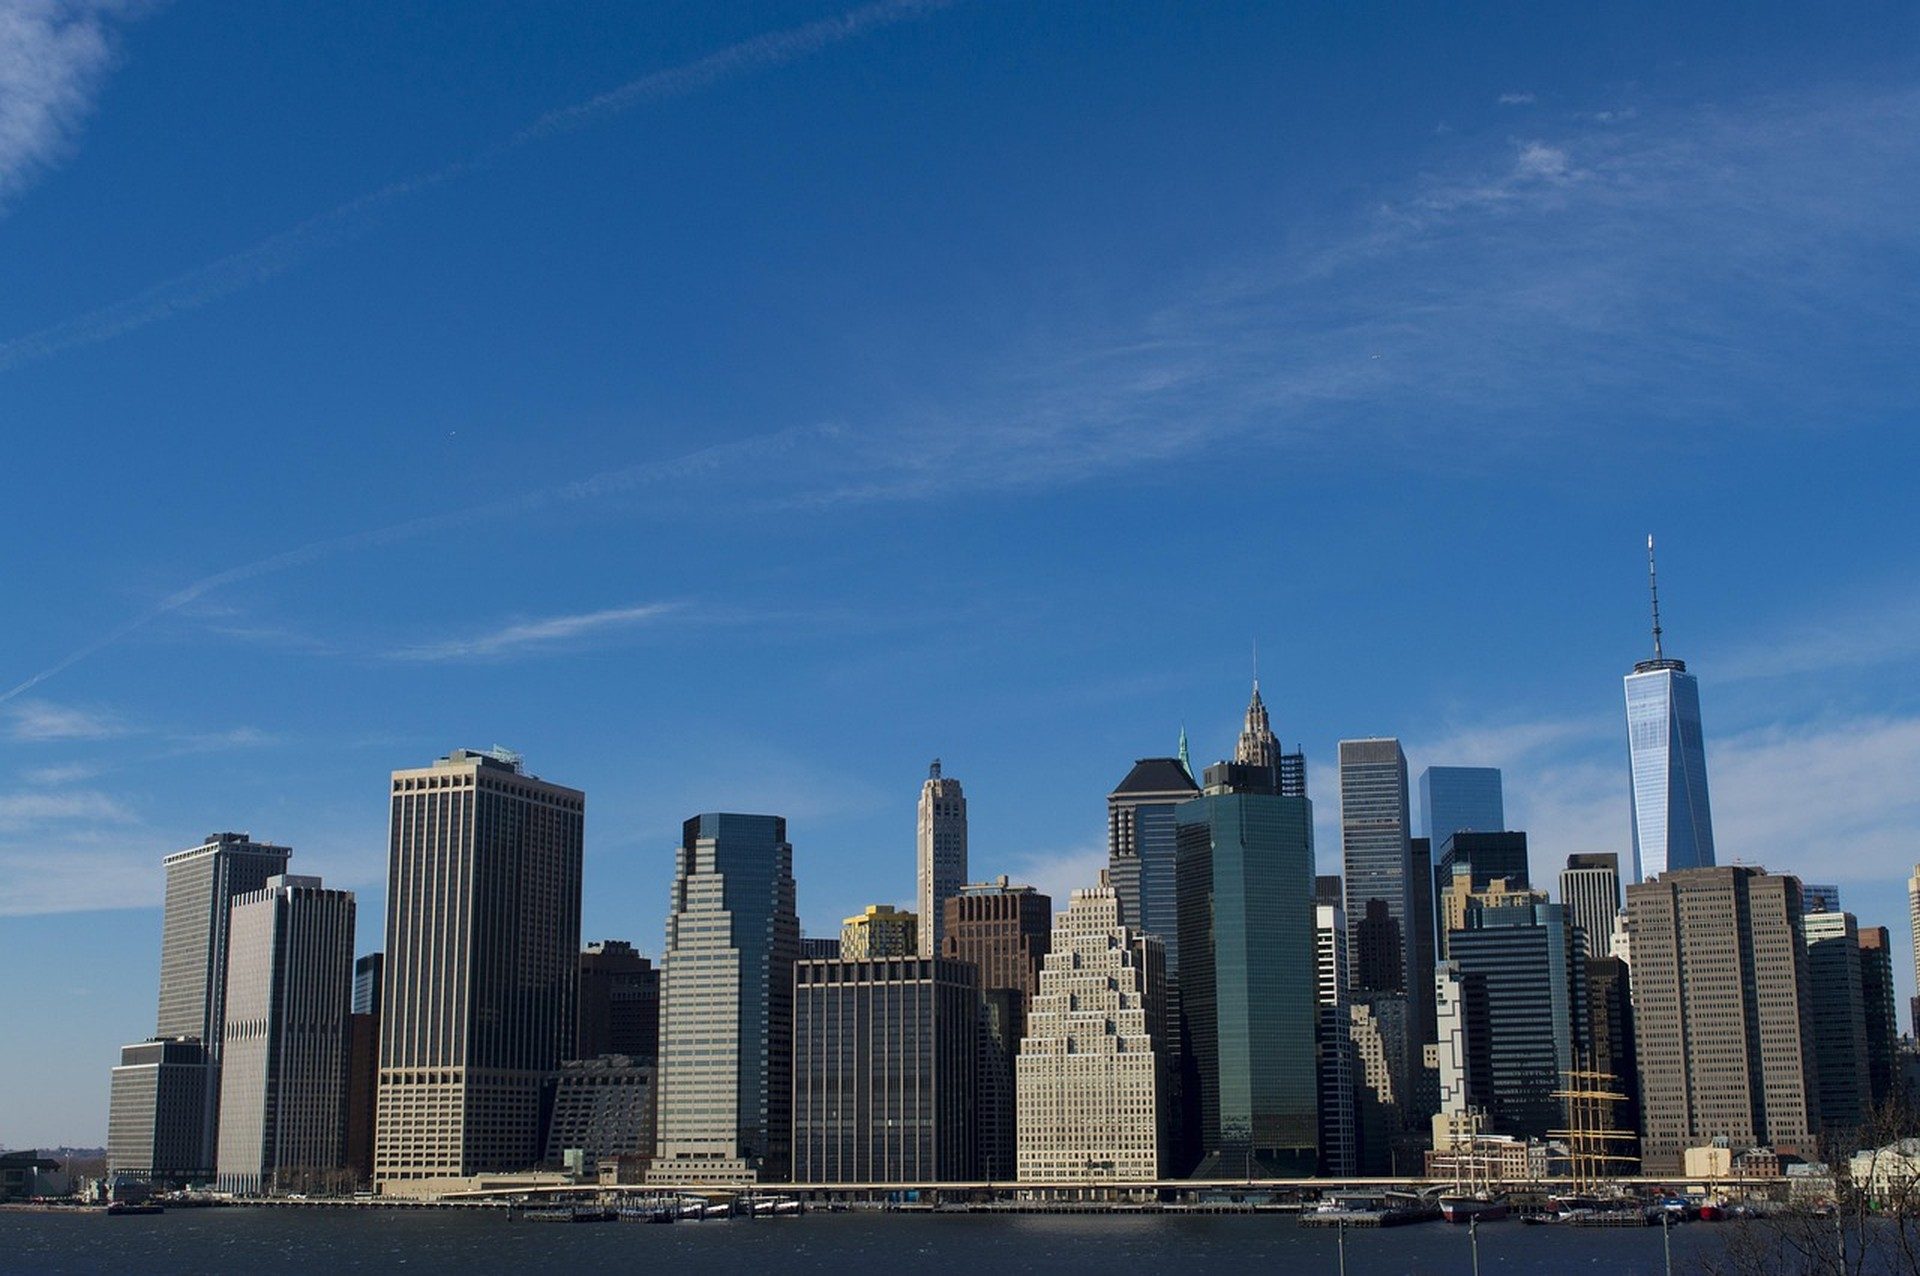
Price growth in New York rarely moves as a single tide. Secondary submarkets, those districts beyond the most famous Manhattan towers, often register gains that look nothing like Midtown averages. Readers who want a clear view of where values are climbing, stalling, or quietly outpacing expectations need a side-by-side reading of Brooklyn, Queens, the Bronx, and selected waterfront or industrial-edge pockets. Foundation gathers the contrasts so non-experts can follow the money without drowning in spreadsheets.
Secondary does not mean second-rate. These areas absorb relocating firms, first-time buyers, and renters pushed by core costs. Their price paths reflect transit access, zoning shifts, and local employment more than luxury penthouse auctions. Comparing them reveals which corridors are firming fastest and which still lag.
Uneven Climb: Price Paths Beyond Manhattan Prime Zones
Manhattan’s prime corridors dominate headlines, yet the bulk of New York’s residential stock sits elsewhere. Secondary submarkets frequently post steeper percentage gains when inventory stays tight and demand spills from higher-priced cores. A townhouse block in northern Brooklyn can post double-digit annual lifts while a classic Fifth Avenue co-op posts single digits. The difference is not magic; it is relative scarcity plus improved amenities.
Commercial space follows a related logic. Warehouse conversions and light-industrial strips near logistics nodes have seen asking rents rise faster than older Midtown towers in some recent periods. Tracking that divergence requires looking at sale-price per square foot and rent growth side by side rather than relying on citywide indexes alone. Official statistics from the Federal Reserve Bank of New York help place local real-estate cycles inside the broader regional economy.
Anyone new to the conversation can start with the plain-language overview in Manhattan Office Vacancy by Submarket: What New Readers Should Know before turning attention outward. Vacancy patterns in the core often foreshadow migration of tenants into secondary districts, which then accelerates price growth there.
Brooklyn's Secondary Nodes Versus Queens Hotspots
Brooklyn’s emerging stretches, from Gowanus canalside blocks to parts of Sunset Park, have recorded notable residential appreciation when new mixed-use projects open. Queens counterparts, especially Long Island City edges and western Flushing, sometimes match or exceed those rates because of denser transit links. Direct comparison shows Brooklyn gains often tied to lifestyle amenities while Queens gains lean more on employment density and airport-adjacent logistics.
Sale prices for multifamily buildings illustrate the split. In several recent years a two-family property near the waterfront in southern Brooklyn outpaced a similar building farther inland by several percentage points. Across the river, certain Jackson Heights and Astoria corridors posted steadier but still competitive climbs. Readers seeking practical frameworks for Brooklyn can consult A Smart Strategy Playbook for Brooklyn's Emerging Neighborhoods for neighborhood-level tactics that align with these price movements.
Queens data frequently appear in municipal dashboards maintained by the City of New York, which publish permit activity and assessed-value trends useful for grounding any comparison. Cross-checking those figures against private brokerage reports reduces the chance of mistaking a short-lived spike for durable growth.
Bronx Corridors and Their Distinct Appreciation Trajectories
The Bronx has posted some of the city’s fastest residential price gains in selected corridors over the last decade, particularly near revitalized transit hubs and hospital clusters. Percentage increases can look dramatic because starting bases were lower. That math matters: a 15 percent jump from a modest base can still leave absolute prices well below Brooklyn waterfront equivalents.
Commercial activity in the borough follows industrial and healthcare anchors more than pure office demand. Warehouse and distribution facilities near major roadways have seen rent growth that outruns certain older Manhattan Class B buildings. Understanding the difference prevents treating every “secondary” label as identical.
Infrastructure spending remains a quiet accelerant. Details on outer-borough capital projects appear in Infrastructure Investment Driving Growth in New York's Outer Boroughs, which ties transit and streetscape upgrades to subsequent value shifts. Those upgrades often convert formerly overlooked blocks into genuine secondary submarkets with measurable price growth.
Transit Projects as Quiet Drivers of Local Values
New stations or improved busways rarely raise prices overnight, yet repeated studies show multi-year lifts once reliable service arrives. A secondary submarket that gains a direct subway connection can post cumulative residential gains of 20 percent or more over five years relative to an otherwise similar neighborhood without the link. The mechanism is simple: shorter commutes expand the pool of possible buyers and tenants.
Lease expirations in large projects can also redirect demand. The pipeline discussed in Hudson Yards Lease Expiration Pipeline: Explained in Plain Language illustrates how even a high-profile district can release tenants who then consider secondary locations, supporting rents and sale prices there. Secondary owners who monitor such pipelines position themselves to capture relocating demand.
Global capital flows further shape the picture. Comparative research available through IMF publications occasionally examines urban secondary markets worldwide, offering context for why New York’s outer districts attract both domestic and foreign capital during periods of core-market caution.
Residential Versus Commercial Rates in Fringe Areas
Residential price growth and commercial rent growth rarely march in lockstep inside secondary submarkets. A neighborhood can see strong co-op and condo gains while local retail spaces sit half empty. The reverse also occurs: industrial and flex-office rents climb while nearby residential inventory softens after a wave of new construction.
Investors and residents therefore need separate lenses. Housing demand responds to household formation, interest rates, and remote-work patterns. Commercial demand responds to logistics, healthcare expansion, and creative-industry clustering. Treating both asset types as one “price growth” number obscures useful signals.
Looking ahead, 2026 scenarios for the core market appear in Manhattan Real Estate in 2026: Office Dislocation and the Debt Maturity Wave. Those scenarios matter for secondary districts because distressed core assets can free capital or tenants that then flow outward, either accelerating or cooling fringe prices depending on volume and timing.
Interpreting Year-Over-Year Shifts for Everyday Decisions
Year-over-year percentages are easy to quote and easy to misread. A 12 percent jump after a flat year looks large, yet the two-year compounded rate may sit near historical averages. Secondary submarkets with thin sales volumes amplify this problem: three high-end transactions can swing the index more than dozens of modest ones.
Seasonality also distorts. Spring listing surges differ from winter closings. Anyone comparing Brooklyn to Queens should therefore examine multi-year medians and inventory counts, not single-month headlines. Housing-market research from HUD User research supplies national benchmarks that help judge whether a local secondary submarket is truly outperforming or simply catching up after a lag.
Foundation’s own New York Real Estate Market Trends archive collects successive reports that let readers watch the same districts across multiple cycles. That longitudinal view is more useful than any single snapshot for deciding whether current price growth looks durable.
Risks Hidden in Rapid Local Climbs
Fast price growth can mask rising property taxes, insurance costs, and maintenance burdens that erode real returns. Secondary submarkets sometimes lack the deep buyer pools of prime zones, so a sudden interest-rate rise can freeze sales and reverse recent gains more sharply. Overbuilding of condos or rental product can also flood a small neighborhood and stall appreciation for years.
Zoning changes cut both ways. Upzoning can lift land values while also inviting competing supply. Residents and owners who track public hearings stay ahead of these pivots. Common questions about market reading and local policy appear in the site’s FAQ (frequently asked questions), which addresses measurement methods and data limits in everyday language.
Additional essays and updates continue to appear on the Foundation Blog, giving readers a running commentary as fresh sales data arrive. Secondary submarkets evolve; staying current prevents yesterday’s growth story from becoming tomorrow’s cautionary tale.
Comparing price growth across New York’s secondary submarkets ultimately rewards patience and local detail. Percentage jumps look similar on a chart until absolute levels, asset types, and transit realities are restored to the conversation. Buyers, renters, and smaller investors who master those distinctions make clearer decisions than those who treat every outer district as interchangeable. The numbers keep changing, yet the need for careful neighborhood-level reading remains constant.
Related Foundation reading: About us, Foundation Israel, and What Is Urban Repositioning and Why Does It Matter in New York?.
Timeless Value. Perpetual Legacy.



